Economic Dimension
We know that the challenges in the future will be much larger, but the will to work can help to overcome adversity, because when you love what you do, things become much easier.
Economic Scenario
In order to stimulate economic activity in a strong downturn, the Federal Government, in early 2013, has kept the interest rate at 7.25% per year, the lowest level in history, as well as deepened exemptions from taxes and increased exponentially loans at subsidized interest rates of the National Bank for Economic and Social Development (BNDES). By mid-year, external factors - in particular, the monetary policy decisions of the United States - have caused upheaval in the macroeconomic scenario: the dollar rose against the real, increasing pressure on inflation. The combined risk of food prices and the official inflation rates dropped to a level above the official target ceiling, leading the central bank to respond with monetary tightening during the remainder of the year.
Frustrated trying to speed up the activity level, the federal government abandoned old political dogmas and assembled a package of concessions of public services to the private sector, to clear the obstacles of infrastructure to growth and increase the rate of investment. However, inflation, as measured by the National Consumer Price Index (IPCA), was maintained throughout the year above the central target and ended the period accumulating a high of 5.91%, the prime rate closed the year at 10% per year and the growth rate of Gross Domestic Product (GDP) must not exceed 2.5%. Already the dollar, driven by global uncertainty, ended the year at R $ 2.34, representing an annual depreciation of 15%.
For 2014, there are more questions than consensus, whether by difficulty discern the effects of the reduction of monetary stimulus by the U.S. Federal Reserve Bank, whether by internal uncertainties of the presidential elections. Anyway, modest fall in inflation, equal to or lower than the previous fiscal policy and still no target year growth are the synthesis of the best predictors for the period.
Financial Performance of Parent
Revenue
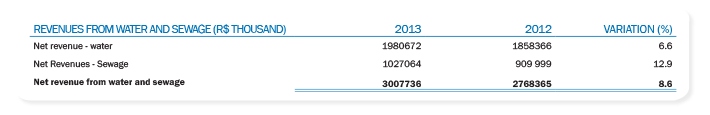
Net operating revenue from water and sewage Parent reached R$ 3.01 billion in 2013, representing an increase of 8.6% over the value recorded in 2012, which was R $ 2.77 billion. This increase was due to:
- 3.5% increase in the number of water savings and 5.9% in the number of sewage units, Copasa result of efforts to increase the coverage of services in the state of Minas Gerais;
- average rate increase of 5.25%, which came into force from May 13, 2013;
- change in the percentage of charging the sewage, depending on the start-up of STPs.
Following comparative table of net revenue from water and sewage in 2013 and 2012:
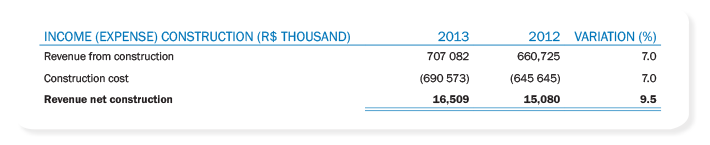
Have construction revenues increased by 7% compared to the year 2012, as the following table:
Costs and expenses
In fiscal 2013, cost of services, administrative expenses and selling expenses totaled R$ 2.29 billion, 13.6% higher value than recorded in 2012, which was R $ 2.01 billion. The following table shows, in detail, the evolution of the Company's costs in the comparative periods:
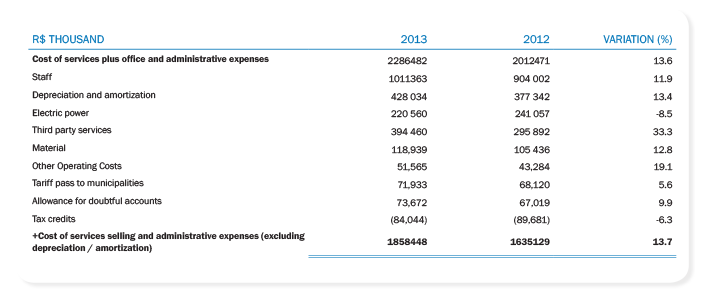
The items that most impacted Copasa costs in 2013 compared to 2012 were:
- Staff:
increase of 11.9%, mainly due to the collective bargaining agreement, whose base date is May, to 2.2% increase in the number of employees of the Company, and to spending on the program Voluntary Retired Employee and / or conditions Retire, which totaled R $ 26.8 million in 2013 from R $ 8.7 million in 2012. In 2013, spending on this program accounted for 2.6% of total payroll costs (1.0% in 2012); - Depreciation and amortization:
rise of 13.4%, due to the start of depreciation / amortization of assets due to the incorporation of assets and works closed during the comparative period; - Electricity:
energy expenditure in 2013 decreased by 8.5% (£ 20.5 million), due especially to the drop in electricity tariff from January 2013, around 20%, depending on the measure Act No. 579/2012. This decrease was partially offset by the annual rate adjustment of the electric utility, which occurred in April 2013; - Third-party services:
increase of 33.3%, mainly due to rising expenditures for repair and maintenance of goods and service systems, resulting from new contracts with higher unit prices, considering that the heating demand in the construction sector has impacted the prices of labor services. These expenses were also influenced by new contracts to provide services arising from the Company's expansion and the increase in spending on advertising, aiming to disseminate the Água da Gente Program; - Materials:
increase of 12.8%, primarily due to increased spending on treatment materials, fuels / lubricants and conservation and maintenance of systems, due to the increase in consumption due to the expansion of the Company's materials, and increased price of these products; - Tax credits:
decrease of 6.3% due to the reduction of energy expenses, which is one of the items that contribute most to the recovery of the credits.
Other income (expenses)
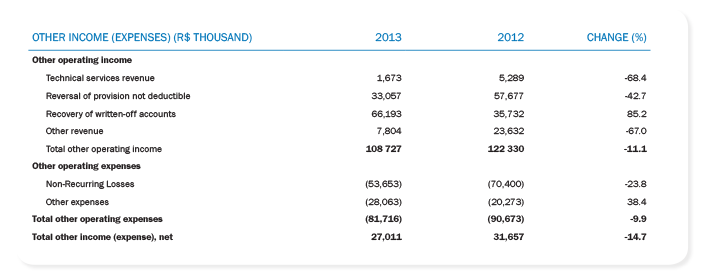
In 2013, other operating revenues decreased by 11.1%, mainly due to the fact that in 2012 there were accounting in other income arising from tax incentive program to clean Watershed in the amount of R $ 7 2 million, which did not occur in 2013. Another factor that weighed in reducing that item was the non-recurrence in 2013 of recovery of tax credits related to the indexation of income tax and social contribution on net income, offset in 2012, amounting to R $ 7.5 million tax; and additional compensation costs Food Program Worker previous years, amounting to £ 12 million.
Have other operating expenses fell 9.9% due to reduction of the amounts accrued for litigation. The table below shows the values in the comparative periods:
Ebitda
The 2013 EBITDA was calculated according to CVM Resolution No. 527/2012, that is covering the revenue and construction costs, which were at $ 1.16 billion, against R$ 1.14 billion in 2012. Excluding the revenues and expenses of construction, the value of adjusted EBITDA in 2013 was R $ 1.14 billion, with an EBITDA margin of 36.3%, according to the following table:
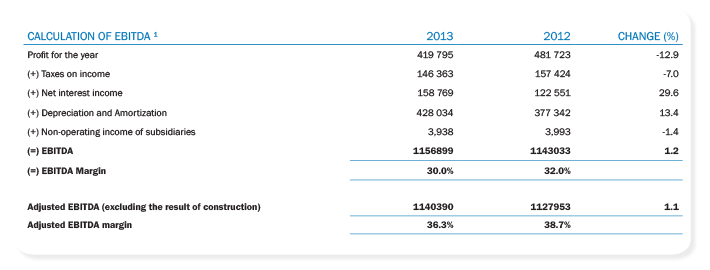
Note: 1 EBITDA is not an accounting measure prepared by the Company, calculated by observing the CVM Instruction No. 527/2012, consisting of net income plus income taxes, net interest income, depreciation, amortization and non-operating income of the Subsidiaries. The EBITDA margin is calculated on the total revenue (net revenue from water and sewage revenues and construction, plus the other operating income and revenue of the Subsidiaries). Already Adjusted EBITDA is calculated excluding revenues / costs of construction. Revenues from construction, although they have no effect immediate cash, generate implications in the year they are recognized, given that its outcome is part of the calculation basis for the payment of interest on capital / dividends and participation of employee profit sharing.
Income (expense)
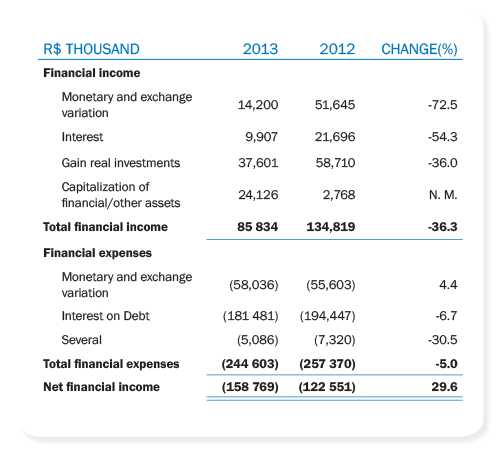
Regarding financial revenue, we highlight the reduction in interest rates and real gain items in financial applications, due to lower cash amount available for investment in short-term securities. The variation of the item monetary and exchange variation is mainly explained by the recognition in 2012 of £ 23.1 million relating to the restatement of proceeds from the issuance of debentures contracted with BNDES 4th.
The financial costs, it is noted that, due to the reduced participation of foreign currency debt in total debt Copasa, the appreciation of the euro against the dollar and was real small. It is noteworthy that, in 2012, was recorded in item interest on financing the same amount of R $ 23.1 million related to resources from BNDES (4th issue of debentures) mentioned above. Thus, there was a net loss 29.6% higher in 2013 compared to 2012, from R $ 122.6 million to £ 158.8 million.
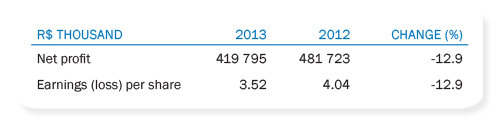
Net Income and Profitability
The net profit of the Company determined in 2013 was R $ 419.8 million, representing a return on equity of 7.9%. The increase in revenues from water and sewage at 8.6% was neutralized by the increase in costs and expenses at 13.6%, the reduction in other operating income by 14.7%, as well as by the increase in net financial expenses 29 6%.
Remuneration to shareholders
In respect to the dividend approved by the Annual and Extraordinary General Meeting held on April 28, 2009 policy, the Board of Directors of the Company decided, for the year 2013, we distributed dividends in the form of interest on capital at the rate of 35 % of net income, adjusted for any decrease or increase in the amounts specified in items I, II and III of art. 202 of Law No. 6.404/1976. This percentage is above the legal and statutory minimum. Such distributions have been carried out in the form of interest on capital, ad referendum the Annual General Meeting, as provided in the Bylaws. At the General Meeting of Shareholders, were ratified distributions for the year. In the following table, we present the declarations of interest on shareholders' equity for the year 2013.
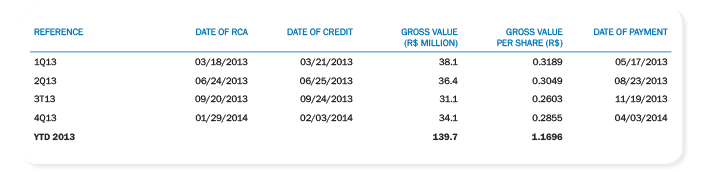
For the coming years, as defined in dividend policy, the Board of Directors to define the percentage to be distributed as interest on capital, within the limit of 50% of net income. The distribution will occur quarterly, giving up the payment within 60 days after each distribution.
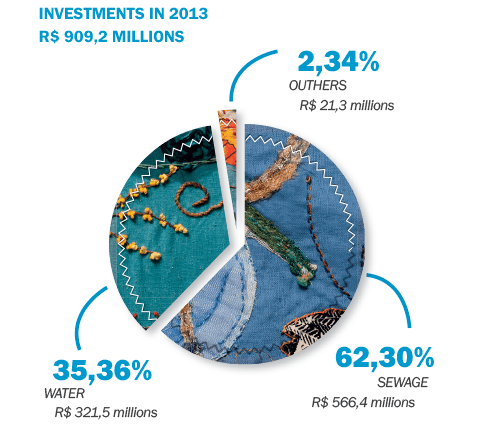
Investments
The investments made in 2013 totaled R$ 909.2 million. Of this total, R $ 321.5 million was invested in water supply systems, R$ 566.4 million was allocated to the collection and treatment of sewage and £ 21.3 million was invested in systems other business development programs and operational.
In addition to using their own resources, the investments have been equated by loans from the Federal Savings Bank, the BNDES and German bank Kreditanstalt fur Wiederanufbau (KfW).
Regarding investments in water supply systems, stand out from those intended to complement interconnecting pipeline in northwest metropolitan area of Belo Horizonte and the expansion of production capacity of the Velhas River system in the Metropolitan Region of Belo Horizonte and others for the deployment of water supply of Passfield, Fama and Santana Desert and the expansion of service capacity of the water supply of many cities, such as systems system: Belo Horizonte, Minas Campos, Cassia, Cruzília, Count, Coromandel, Divinópolis, Esmeraldas, Felixlândia, Itamarandiba, Nova Lima, Silver, Raposos, Ribeirão das Neves, Rio Manso, Santa Vitória, Gotthard, Taiobeiras and Uba.
In relation to sewage systems, we highlight the investments for the expansion of sewage from Belo Horizonte / Count (Meta 2014), Cataguases, Pedro Leopoldo and Pouso Alegre, Vespasian and ETE Arrudas systems; works for the construction of STPs in Almenara, Barbacena, Betim (Central ETE) Caratinga, Conceição do Mato Dentro, Divinópolis, Extreme, Ibirité, Jequitinhonha Justinópolis, Ribeirão das Neves, Martin Fields, Monte Azul, Nova Serrana, Raposos, Santa Luzia, Santo Antonio Mount, Santos Dumont, Gotthard, São Sebastião do Paraíso, Teofilo Otoni and Three Hearts, and the implementation of sewage systems Camanducaia, Carmo Paranaíba, Captain Aeneas, Carbonita, Colonel Fabriciano, Francis Dumont, Itacarambi, Otter, Toddler , Serra dos Aimorés, Johnstown Bridge, Varzelândia and Verdun.
Capital market
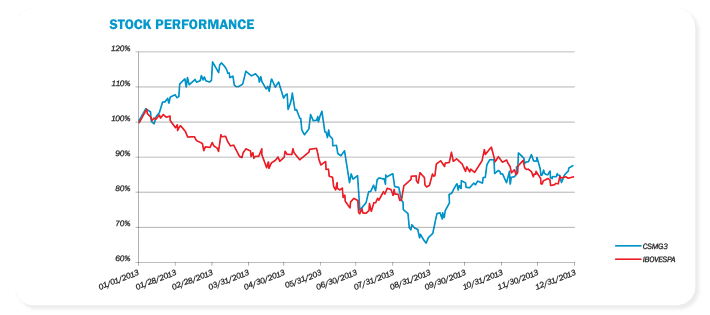
Copasa's shares are traded on the BM & FBOVESPA under the CSMG3 code, and is listed on the Novo Mercado Special Corporate Governance since the IPO, held in 2006.
The share capital of the Company as of December 31, 2013 was R $ 2.77 billion, represented by 119,684,430 common shares. Of this total, 51.1% belonged to the State of Minas Gerais, 48.6% were in circulation (free float) and the remainder (0.3%) was in cash.
In 2013, the share price, adjusted for interest on capital, a decrease of 12.3%, whereas in the same period, the Bovespa index, which serves as an indicator of the average performance of the stock prices of most marketable and representativeness of the Brazilian capital market, decreased by 15.5%. On December 31, 2013, the market value of the Company amounted to R$ 4.2 billion.
In 2013, shares of Copasa were present in 100% of the sessions, with an average daily trading volume of R $ 11.7 million and an average of 1,600 trades per day. Their actions are part of important indices of the BM & FBOVESPA, being the highlight IBrX-Brazil Index (which lists the 100 most liquid stocks on the stock exchange), the Stock Index Tag Along (ITAG), the Corporate Governance Index (IGC), the Corporate Governance Index Novo Mercado (IGNM), the index Small Caps (SMLL) and the Corporate Governance Index Trade (IGCT). Moreover, Copasa was again selected to integrate, in 2014, the theoretical portfolio of ISE BM & FBOVESPA, which aggregates companies that have differentiated commitment to sustainability and environmental responsibility.
Operational and commercial performance
(GRI 2.8)
The population served with water supply increased by 484 thousand people, a percentage increase of 3.4%, reaching approximately 14.6 million inhabitants at the end of 2013. This performance reflects the expansion of Copasa and Copanor, evidenced by the addition of 136,000 new water connections throughout the period.
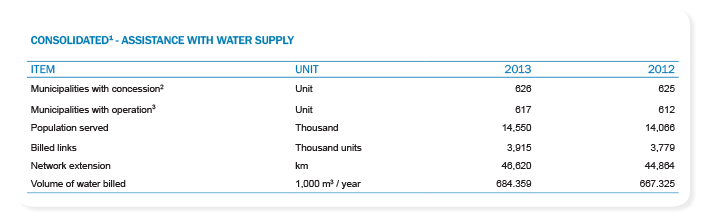
Notes: 1 Includes locations served by Copasa and the Copanor. 2 Total municipalities in which the company holds any concessions (seats, villages, settlements or other). 3 Total municipalities in which the company operates any concessions (seats, villages, settlements or other).
In sewage services, the total number of cities increased from 200 in 2012 to 223 in 2013, benefiting a population of 9.3 million, an increase of 543 thousand people attended. This service is carried by 2.4 million sewage building connections, which in 2013 showed an increase of 6.5%, that is, 146 thousand new connections, of which approximately 43,000 are due to start operations in new locations. The collection network was expanded in 2045 km, totaling more than 22,100 km.
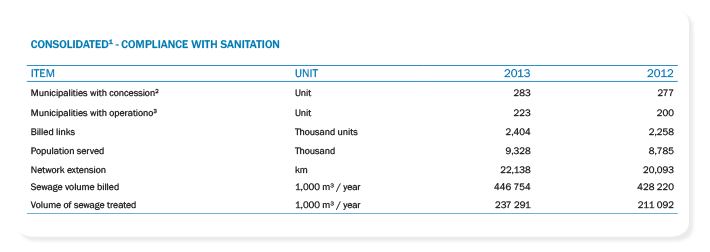
Notes: 1 Includes locations served by Copasa and the Copanor. 2 Total municipalities in which the company holds any concessions (seats, villages, settlements or other). 3 Total municipalities in which the company operates any concessions (seats, villages, settlements or other).
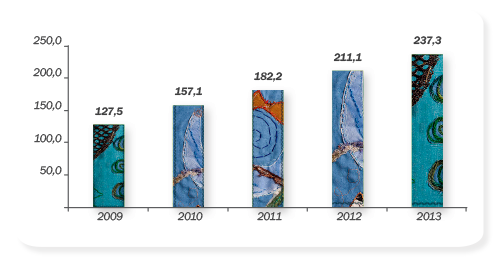
The volume of sewage treated by the Company amounted to 237.3 billion liters, with a percentage increase of 12% over the previous year, the operation of 19 new STPs have been initiated in several cities in the state of Minas Gerais, among which Conceição do Mato Dentro, Mirabela, Montacute, Salinas, Santa Luzia (ETE headquarters) and Santa Rita do Sapucai.
Volume of Sewage Treated (million m³)
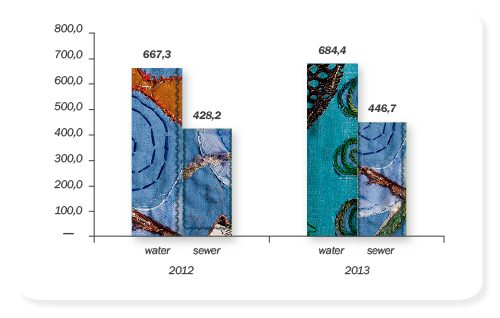
In 2013, the expansion of the Company increased the volume of water billed at 17.0 billion liters and 18.5 billion liters of sewage volume billed. The expansion of water and sanitation in villages that were already operated supply and start billing for water and sewage services in new locations, such as municipal headquarters Buenópolis, White Grass, Centralina, Mughal, Mirabela, Montacute and Sabara, contributed to this growth.
Billed Volume (million m³)
Also emphasize the results achieved in terms of staff productivity, as measured by total employees/1.000 connections (water and sewage), which increased from 1.96 employees/1.000 bonds in 2012 to 1.93 in 2013.
The following table sets forth, for the indicated period, the performance of certain operational / business indicators:
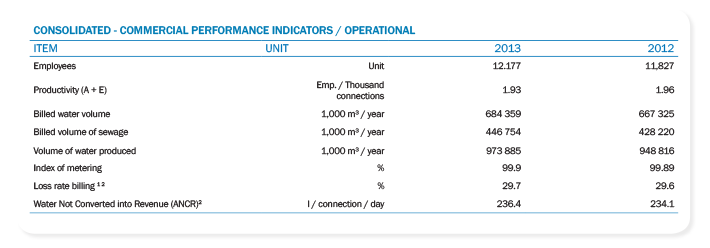
Notes: 1 Average annual. 2 Data Controller.
Commercial Management
Rates
The provision of water and collection and treatment of sewage are paid in the form of tariffs. The tariff policy applied by Copasa is regulated by ARSAE-MG.
Rates are differentiated according to categories - social, residential, commercial, industrial and public - and consumer groups. His determination takes into account the economic and financial balance of the concession and the preservation of the social aspects of public sanitation services operated by Copasa. Furthermore, are progressive in relation to billable volume, that is, those who consume more pay more per liter than those who consume less. This tariff policy benefits the population, raising awareness for proper water consumption.
The rate of sewage collection and treatment equivalent to 90% of the water rate and sewage collection with and without treatment rate is 50% of the water tariff. Rate adjustments are annual and previously approved and authorized by ARSAE-MG. In 2013, an average rate increase of 5.25%, approved by Normative Resolution ARSAE-MG No 35/2013 of 12 April 2013 was applied.
Billing
The customer base of Copasa is diverse and sprayed, especially the portion from the residential consumption, equivalent to 69.7% of revenue, which reduces dependence or company's exposure to a particular customer or group of customers. The ten largest customers account for only 5.7% of revenue and the top 50 by only 7.7%.
The Company works with different billing cycles, depending on the period of time between the water meter reading and the maturity of the account, which impacts the agility of storage. In 2013Two types of cycle was applied: in 94.5% Billing, corresponding to locations with better access infrastructure, we applied the lower cycle consists of 15 working days, the larger cycle of 20 days, was applied in locations with poor infrastructure access, representing 5.5% billing.
Delinquency
The delinquency ratio, which corresponds to the ratio between the balance of accounts receivable and the total amount billed considering cumulative data since January 1998, reached 1.39% in 2013 and is considered one of the best in the country and reference to other companies operating in the sector.
Delinquency rates have been declining steadily in recent years as a result of a consistent trade policy, which has among its pillars development firm collection actions and debt negotiation policy with large customers and public administration.
Key risks, opportunities and strategies
(GRI 1.2; 4.11; EC2)
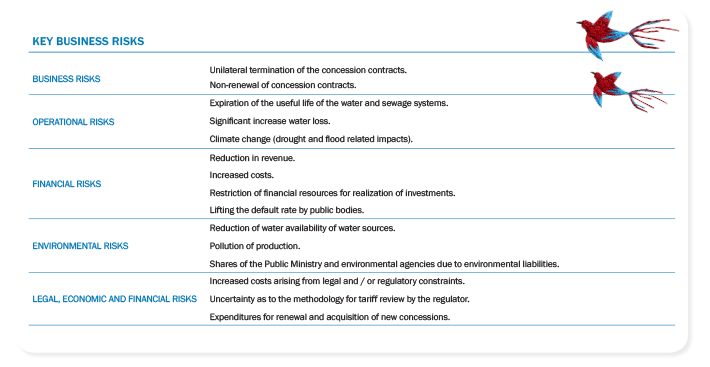
In developing a strategic planning process are identified and analyzed business risks that may affect the proper functioning of the Company and its sustainable development. This identification enables proactive performance of the company, aiming to address these risks.
Copasa established in June 2012, a working group with the objective to identify and pursue the best methodology in the market for corporate management, risks whose members conducted research and technical visits benchmarking and participated in forums and trainings related to the topic. Also hired a specialized company to provide consulting services to the group in developing the corporate risk management process, based on standards set by Committee of Sponsoring Organizations of the Tread way Commission (COSO) in your document COSO II - ERM, aiming identify, assess, measure, assemble matrix, proposed treatment, establishing action plans, communicate and monitor corporate risks that may impact the company and influence the achievement of strategic objectives. According to the general plan of work and its schedule, the project will be completed in May 2014. This process is an initiative of the strategic objective of increasing the efficiency and effectiveness of processes.
Corporate risks have been identified as having grants: risk library public service sector presented by the consultant, consultation with department heads and superintendents, and individual interviews with all directors. Subsequently, the Internal Audit team and the working group reviewed the identified risks, classifying them in strategic, financial, operational, regulatory, legal and compliance. Then in workshop risk management, department heads, superintendents, counselors, master analysts and strategic project coordinators assessed the inherent impact criteria and probability risk and forms of treatment adopted by the company for its mitigation, resulting in the assessment of the residual risks same criteria.
From the evaluation of the relevance of risks, risk matrix, which will be prioritized as to its criticality, considering the aspects of impact and probability will be defined. The risk map will display the most relevant risks.
Strategic planning review
The strategic planning review occurred in 2013, comprehensive and structured process, with the participation of the entire management team, taking into account the analysis of the macro environment and market performance, the characteristics of the industry and the organization's internal environment. Alternatives resulting from these analyzes were evaluated for redefinition of business fundamentals, setting the strategic positioning of the organization and consolidation of its strategic objectives in order to maximize strengths, correct weaknesses, seize opportunities and mitigate threats.
In this case, entry alternatives were evaluated in new markets, both in and outside of Minas Gerais state, and ways of acting in accordance with established goals, defining initiatives, indicators and targets, as well as their action plans needed the success of strategies. According to the methodology established strategic management, analysis of organizational performance is monitored systematically by the Executive Board and the leaders of strategic objectives, controlling the implementation of the initiatives and their action plans and achievement of goals, using a system of hierarchical meetings, which occur according to pre-established agenda and calendar.
In this strategy management model, the leaders of the goals are responsible for ensuring the implementation of initiatives as planned, respecting deadlines, priorities and costs; ride, guide and motivate those responsible for such initiatives and their working groups in the implementation of action plans , and present the results to the strategic planning manager, with emphasis on the difficulties encountered and possible solutions for consideration and decision of the Board in order to fulfill the institutional mission and achieve the future vision of the organization.